VIX spot is quoted at 17.50%, down small with IV30™ up 15.4% (the volatility of the volatility index). The LIVEVOL® Pro Summary is below.

-------------------------------------------------------
Livevol Execution: Complex Trading Simplified

Click to Learn More
-------------------------------------------------------
Conclusion:
---
If you want to get the real pulse of the market, you can look at the VIX, but it's the volatillity of the VIX that will really tell you where we are. If the implied volatility of the VIX breaches 115%, that would represent a multi-year high; and that could be a signal of a doomsday market reaction.
---
I'm going to discuss the VIX and the overall market as of right now, but first a reminder that I posted an article about the market in general, giving the strong arguments for a bear market and a bull market on Sunday, August 25, 2013. At the time of that post, VIX spot was quoting at 13.98%. You can read that post by clicking on the title, below:
No Noise, Here are the Facts, and Why: The Market Will Go Up. The Market Will Go Down.
The summary reads like this:
---
So the question is, where is the market headed? The trick is we'll get a different answer everyday based on the use of selective economic data that's needed to support a thesis. Ya know how it goes-- on down days there's always bad economic data to report, on good news there's also good economic data to report. Exhausting -- though it does sell commercial advertisements.
So who's lying?... Well nobody... Let's take a look at what's actually happening right now -- then we can decide where the market is going.
NB: The primary sources for this article are:
1. Here’s Why Bernanke and the Fed Seem Confused, via The Exchange - Friday, August 23, 2013.
2. U.S. August auto sales to rise 12 percent: J.D. Power & LMC, via Reuters – Thu, Aug 22, 2013 11:09 AM EDT.
3. United States Department of Labor
4. 7 reasons for a September crash, via MSN Money.
5. Real Wages Decline Again — Literally No One Notices, via Business Insider
Good News
The Fed is ever present and aware. Quantitative Easing has worked to achieve its primary goal of accelerating the housing recovery:
1. Home prices bottomed out in 2012 and have been rising by double-digits, year over year.
2. The latest data show existing home sales — which account for more than 90% of the housing market — are up 17% from the levels of last summer.
3. Home Depot (HD) and Lowe’s (LOW) just reported excellent earnings, thanks to home owners spending more money on appliances, fixtures and home-improvement gear.
Other Good Stuff...
4. Car sales are up: "The August annualized monthly sales rate, if realized, would be the highest since November 2007."
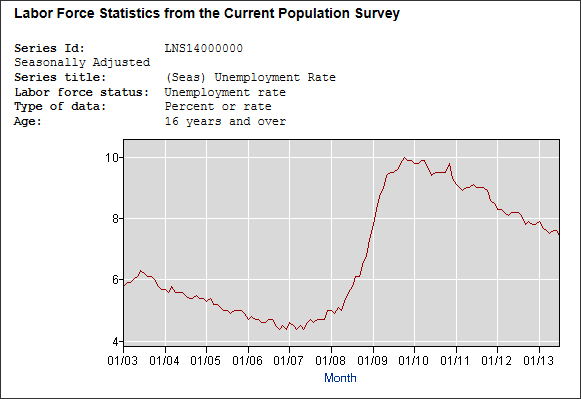
5. Unemployment has been decreasing at a staggering rate according to labor force statistics from the US Dept of Labor. I've included a 16-year chart below, and you can download the raw data from the site here: Labor Force Statistics from the Current Population Survey

Source: US Department of Labor
6. Here's the return of the major US indices over the last year and the VIX (the CBOE volatility index):
DOW: +14.96%
S&P 500: +18.65%
NASDAQ: +19.79%
VIX: -12.41%
So... home prices are up, bellwether stocks HD and LOW are up, unemployment is down substantially, car sales are at six-year highs, the major US indices are up substantially above their long-term averages and the VIX ("fear index") is down and has remained down.
The US is OK -- better than OK... Is there even an argument?... Yeah, as it turns out, there is....
Bad News
1. The Fed is unclear on its stance toward QE and tapering -- remarkably unclear. The market dropped 6% this June when Fed tapering started becoming a serious issue. Now, the Fed's Sept. 17 (and 18th) meeting looms quite large. The Fed's direction is not only unclear, it's efficacy in achieving it's main goal is also unclear. Which direction is the housing market moving? We know existing home sales are looking good but...
2. The latest data also show that new-home sales, which have less of a lag than the existing-home numbers and may better reflect real-time conditions, fell unexpectedly to a nine-month low.
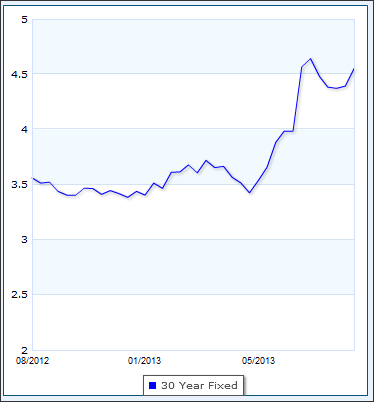
3. Interest rates are rising. That's mortgages and that means home sales (and potentially car sales). I've include a three-year chart of the 30-yr mortgage rate, below (source: BankRate.com).

Source: BankRate.com
Other Bad Stuff...
4. Aside from home-related goods, spending on most other things has been poor. Walmart (WMT), Macy’s (M), Nordstrom (JWN), Target (TGT) and Staples (SPLS) reported disappointing sales recently. "With weak growth in incomes and tax hikes taking a bigger bite out of paychecks this year, consumers don’t seem to have the money to boost spending by much. And there’s no new income source on the horizon." Lest we forget, WMT is the largest US employer.
5. Unemployment is not what it seems. In a Forbes article for 4-8-2013 entitled: "Unemployment Is Really 14.3%--Not 7.6%," we get a stark contrast to a conclusion of an apparent employment recovery. I've included some snippets below (bolding was added by me).
---
These numbers added together suggest that the true unemployment level– when part-time workers are included– is 14.3%–meaning that one in seven of every potential full-time employee in the U.S. economy is not able to earn a proper living wage–and thereby contribute to the snails-pace of economic growth.
Moreover, the percentage of people employed is only 58.5%, down from 61%, the level hit in 2008 when Obama was first elected–and to be fair before the meltdown on Wall Street. And the jump in first-time unemployment claims last week was the highest level since last November.
Source: Forbes Unemployment Is Really 14.3%--Not 7.6%
---
The unemployment data re-evaluated and the earnings from WMT, M, JWN and TGT not merely flies in the ointment of overwhelming recovery data. I'll repeat the line from the article above: "the percentage of people employed is only 58.5%, down from 61%, the level hit in 2008."
6. Beyond unemployment of course is the real wages argument, or at this point, phenomenon. Here's a snippet from Business Insider:
---
Real wages fell 0.2% in 2012, down from $295.49 (1982-84 dollars) to $294.83 per week, according to the 2013 Economic Report of the President. Thus, a 1.9% increase in nominal wages was more than wiped out by inflation, marking the 40th consecutive year that real wages have remained below their 1972 peak.
---
More specifically, even if the unemployment chart is correct, we have lower real dollar median household incomes than in 2007. Yeah, collectively, we're still poorer since before the 'Great Recession.'
7. Margin debt is "at or near all-time highs." That means investors in general are bullish but it also means they may be out of bullets. The caveat here of course is how much cash is sitting on the sidelines. The result is, for the market to go up, new cash will have to be committed... but that's actually not that "bad" or "big" of a deal unless fear builds.
8. Remember the debt ceiling debacle from last year? The downgrade of US debt by S&P? Well, we're about to do the dance again. Come the end of September, the new debt ceiling will be hit again. Last time that happened, the market spasmed down 15% and from what we see in Washington, there is no discussion at any level that is moving the two-parties toward an agreement.
Conclusion
Yeah, the Fed has been sending mixed signals. First b/c their isn't consensus within the group, second b/c their isn't consensus with the data. Is QE the only thing holding up the economy? Is it holding up the economy? Yes corporate profits are at all times highs, but with fewer people employed at and lower wages, you're damn right profits are higher.
Here's one thing I do believe (here comes an opinion), the VIX is too low. Given all of the issues stated above ('good' and 'bad'), a VIX near multi-year lows seems unreasonable. There is a lot of uncertainty and the VIX reads as if there isn't. I think the VIX is wrong. I think the market, one way or the other,will move more than the VIX implies. But ya know what, I too could be wrong... seriously, I could be.
Hopefully, that summary was helpful as we move out of summer and into the fall. The facts will matter, regardless if it's an up or down day and regardless of what "data" sells advertising.
---
OK, today we see the market down again with VIX rising and the real story is #8 above:
"Remember the debt ceiling debacle from last year? The downgrade of US debt by S&P? Well, we're about to do the dance again. Come the end of September, the new debt ceiling will be hit again. Last time that happened, the market spasmed down 15% and from what we see in Washington, there is no discussion at any level that is moving the two-parties toward an agreement."
Let's look at the two-year VIX spot Charts Tab (six months) is below. The top portion is the stock price, the bottom is the vol (IV30™ - red vs HV20™ - blue vs HV180™ - pink).

Two years ago VIX had exploded to nearly 50%, and since then it has come down considerably lower. A 50% VIX isn't sustainable as it is merely a reflection that there is the risk of "something." If the "something" happens, then VIX dives, if the something doesn't happen, the the VIX dives -- same result either way.
Today however we see a VIX at 17.50%. The political stand-off is unclear with respect to result and amount of time it will take to get that result... so that means the direction of the VIX is unclear.
But I'm not actually focused on the VIX, it's the volatility of the VIX that has given me pause for thought. Let's turn to a two-year IV30™ chart in isolation, below.

The vol of the VIX is volatile, so really the vol of the vol of VIX is... volatile... In English, that red curve is very spiky and lacks any real measure of equilibrium. Here's the thing though...
The political stand-of will end. It might take a long time. The US may even default on debt payments (unlikely, but possible). A downgrade of US debt is more likely and remember, the debt rating is based on the highest rating. S&P already downgraded the US debt... What if Moody's does too?...
So let's walk along the string that looks to a catastrophe. Downgraded US debt --> defaults on outstanding debt. Then what? Will the country have a shutdown government forever?
My best bet would be no. If you want to get the real pulse of the market, you can look at the VIX, but it's the vol of the VIX that will really tell you where we are. If the implied volatility of the VIX breaches 115%, that would represent a multi-year high; and that could be a signal of a doomsday market reaction (but not necessarily a doomsday reality). Watch that number. If it closes above 115%, I think a market spasm is a real possibility b/c fear could overpower the market. Until then, I see posturing and fear of fear, but not necessarily anything else.
Follow Live Trades and Order Flow on Twitter: @Livevol_Pro
This is trade analysis, not a recommendation.
Legal Stuff:
http://www.livevolpro.com/help/disclaimer_legal.html
unemployment rate is definetly more like 15% than 7...
ReplyDeleteFool me once. As a short premium trader I would have to be a very slow learner. Thank you for reminding me that the best short premium position in the indexes is probably no position.
ReplyDelete